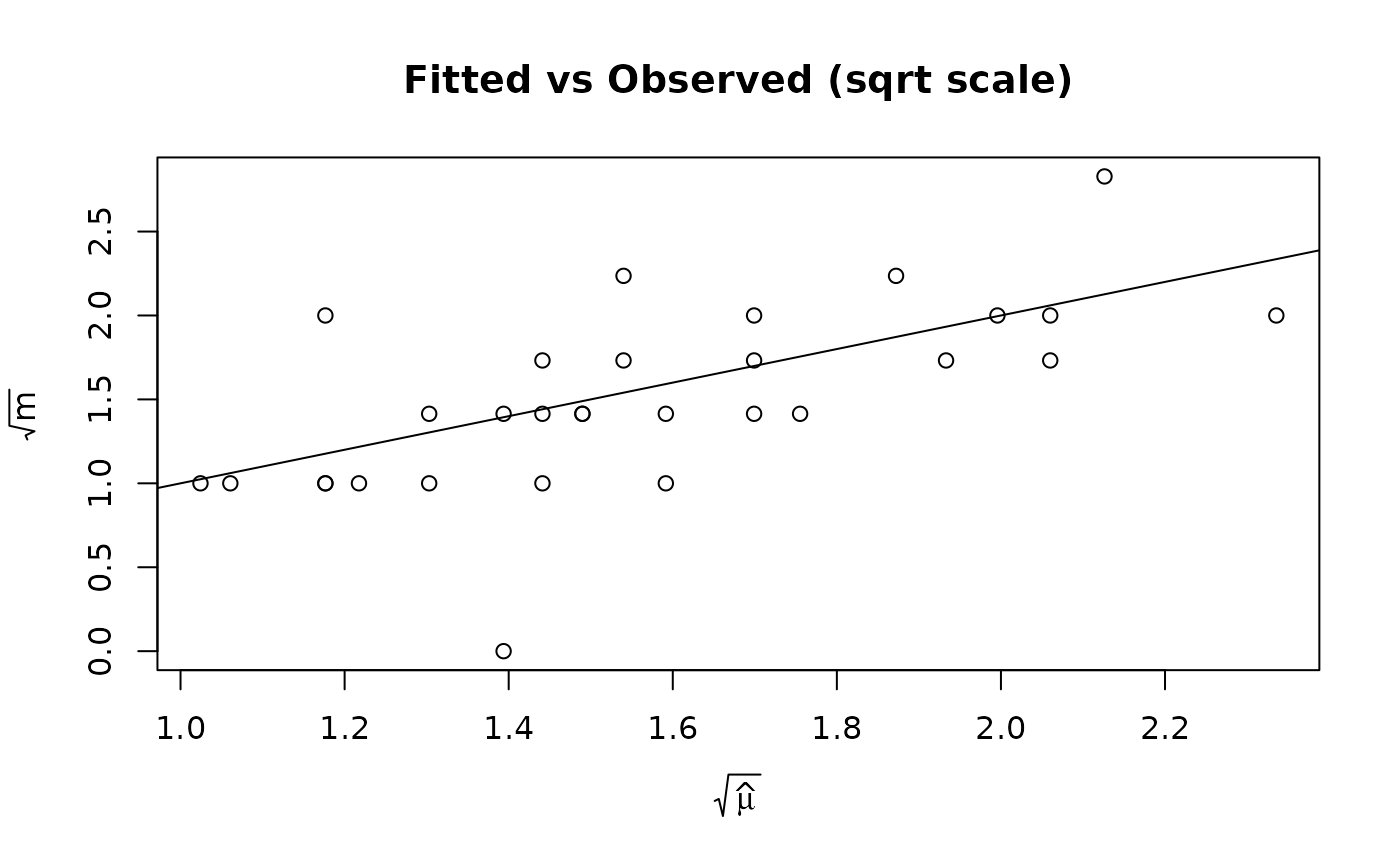
Produces a 4-panel diagnostic display following the recommendations of Zhang (2008) for the power-law hidden-population model. The panels are:
Usage
# S3 method for class 'uncounted'
plot(x, which = 1:4, ask = interactive() && length(which) > 1, ...)
Arguments
- x
An object of class
"uncounted".- which
Integer vector selecting which panels to display (default
1:4).- ask
Logical; if
TRUE(the default in interactive sessions), the user is prompted before each new page.- ...
Additional graphical arguments passed to
plot.
Details
Fitted vs Observed (sqrt scale): Scatterplot of \(\sqrt{m}\) against \(\sqrt{\hat\mu}\) with a 45-degree equality line. Points should cluster around the line if the mean function is correctly specified.
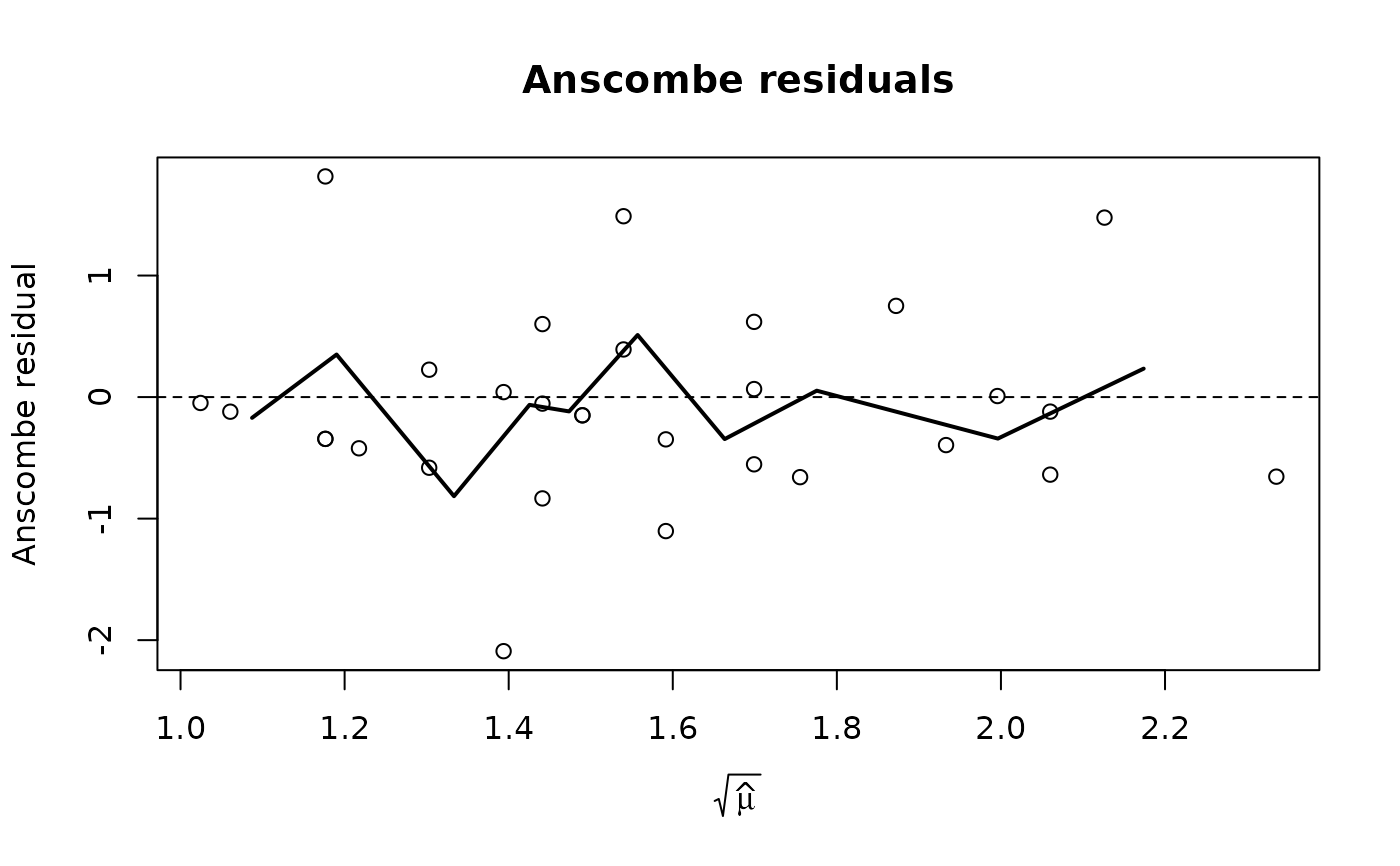
Anscombe residuals vs \(\sqrt{\hat\mu}\): Anscombe (variance-stabilised) residuals plotted against \(\sqrt{\hat\mu}\) with a running-mean smoother. A flat trend near zero indicates no systematic misfit.
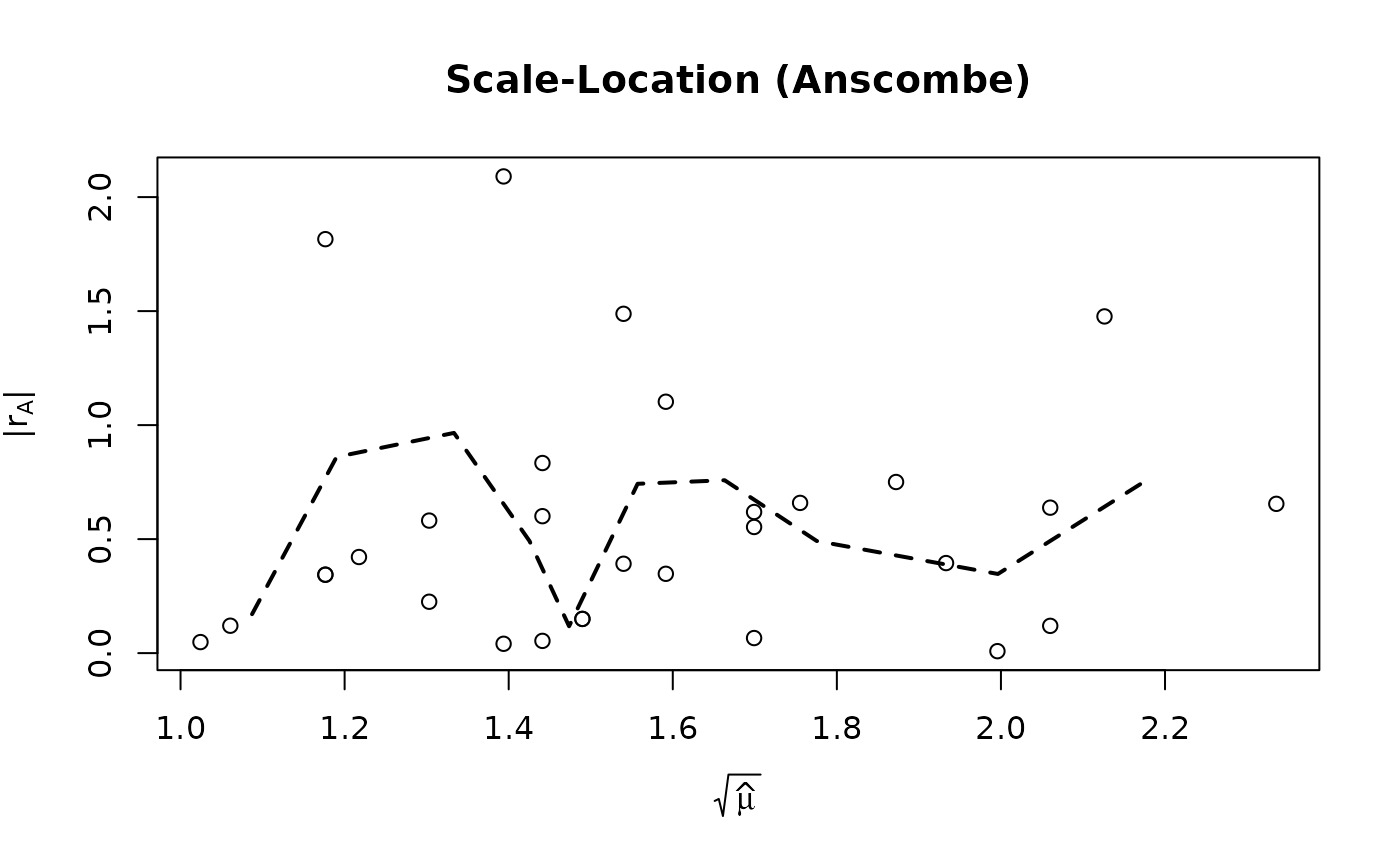
Scale-Location (Anscombe): Absolute Anscombe residuals \(|r_A|\) against \(\sqrt{\hat\mu}\) with a running-mean smoother. An increasing trend suggests under-modelled variance (e.g., overdispersion).
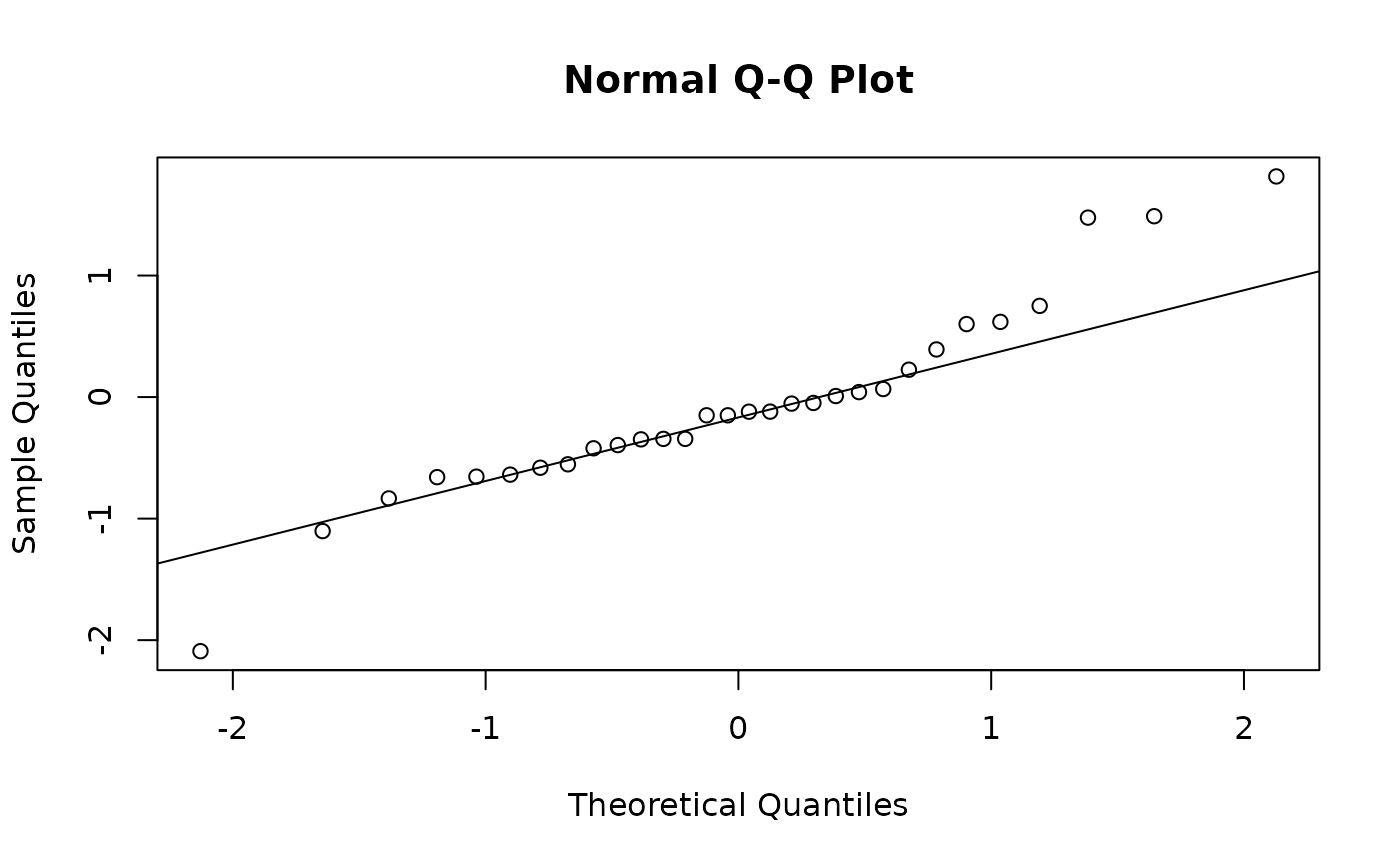
Normal Q-Q Plot: Normal quantile-quantile plot of the Anscombe residuals. For well-specified count models the residuals should be approximately standard normal.
References
Zhang, L.-C. (2008). Developing methods for determining the number of unauthorized foreigners in Norway. Documents 2008/11, Statistics Norway. https://www.ssb.no/a/english/publikasjoner/pdf/doc_200811_en/doc_200811_en.pdf
McCullagh, P. and Nelder, J. A. (1989). Generalized Linear Models, 2nd ed. Chapman & Hall.
Examples
set.seed(123)
df <- data.frame(
  N = rep(1000, 30),
  n = rpois(30, lambda = 50)
)
df$m <- rpois(30, lambda = df$N^0.5 * (df$n / df$N)^0.8)

fit <- estimate_hidden_pop(data = df, observed = ~m, auxiliary = ~n,
                           reference_pop = ~N, method = "poisson")
#> Warning: Some alpha values > 1 (max = 3.271). Population size estimates may be unreliable. Consider using constrained = TRUE or simplifying cov_alpha.

# All four diagnostic panels
plot(fit, ask = FALSE)


# Only the Q-Q plot
plot(fit, which = 4)
# Only the Q-Q plot
plot(fit, which = 4)